5 tips for creating an infographic that grabs attention
Infographics are a type of content that internet users love. Simple, clear and informative, they make knowledge easy to consume — when done well. But how do you create a successful infographic? What elements should you consider to produce an effective infographic that will encourage users to click, read and share?
Growista conducted a study on this topic, and we have extracted the key findings for you!
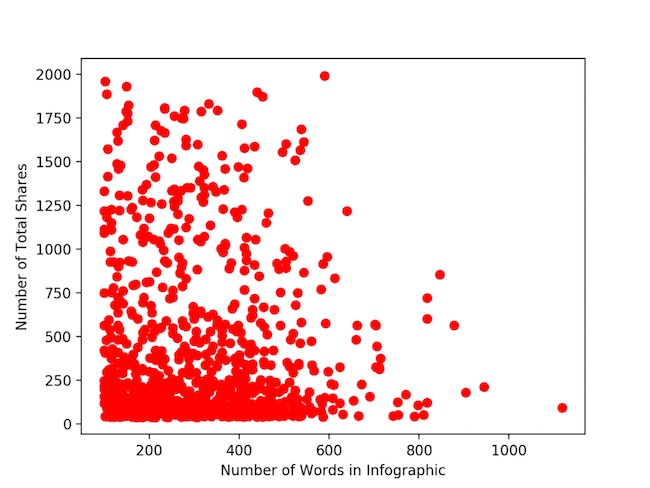
1- How many words?
Infographics present knowledge in an easily digestible form. Do not try to pad out your text or cut it down to the bone: the right number of words in your infographic is the number of words you actually need.
There is no proven evidence that the word count of an infographic affects its success. For example, the number of times an infographic is shared appears to be independent of its word count. Only the interest, the informative and educational nature of the content, matters.
2- What size?
For an ideal infographic, we recommend a width of 600 pixels.
This is the standard width for a blog article. If you go narrower, you risk ending up with an illegible infographic. The same applies if you go wider: an infographic that is too wide will generally be scaled down on users' screens — and therefore become illegible. And nobody engages with content they cannot read.
For the length of the infographic, there is no specific constraint. As long as it contains all the useful information and delivers sufficient added value (the pun is intended!), users will keep scrolling down.
3- How long should titles be?
A title of 65 characters is ideal for two reasons:
- It is the number of characters displayed in Google search results; a truncated title may deter a user, whereas a title displayed in full is more likely to encourage them to click.
- A title that is too short may not adequately convey the information you are sharing; if users cannot grasp the content of your infographic at a glance, they will ignore it.
4- How long should the introduction be?
An introduction generally presents the infographic and provides the context necessary for users to understand it properly.
Keep it short — 200 words. If a user is interested in your infographic, they are looking for information quickly. If it opens with a wall of text, they are likely to abandon it.
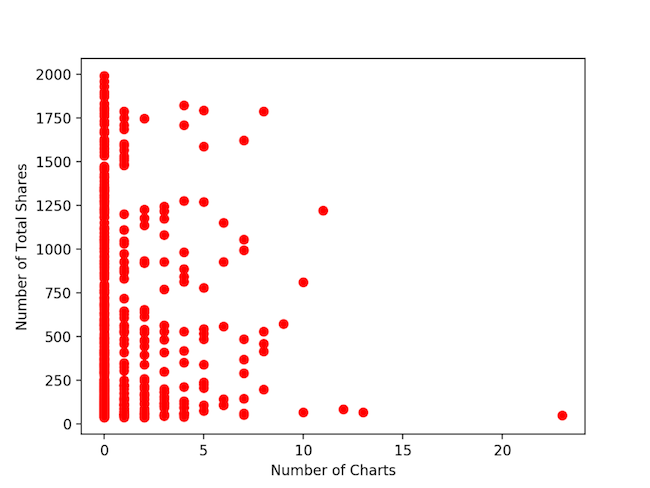
5- How many charts?
This may come as a surprise, but including a large number of charts in your infographic is not necessarily a mark of quality. In fact, the more charts you add, the more complex the data becomes to read. And visually, a succession of charts can be off-putting — two things that may drive users away.
We recommend including only one or two charts in your infographic. Other types of visuals can vary the reading experience and clearly convey the necessary information (lists, illustrations, key words, etc.).
As we have already discussed with data visualisation, visual content has a strong impact on internet users. We hope these few tips inspire you and help you create effective infographics that reach their target audience!
YOU MAY ALSO LIKE
UGC, the future of marketing: How user-generated content can revolutionise your marketing strategy
by Yumea, 7 March 2023
UGC (User Generated Content) is changing the game in the world of marketing. With the rise of social media and content-sharing platforms, the … READ MORE
Category: News , Getting visible online , Social media
Comments: 0
How to use Instagram to reach your audience and drive traffic to your website?
by Yumea, 1 February 2023
Social media has become an indispensable tool for businesses looking to reach their target audience and drive traffic to their website. With more than 3.8 billion active users … READ MORE
Category: Getting visible online , Instagram , Social media
Comments: 0
7 Artificial Intelligence (AI) tools to know in 2023
by Yumea, 12 January 2023
In 2023, there are many platforms using artificial intelligence (AI) to help users write content and generate images. If you are looking for tools to help you write … READ MORE
Category: News
Comments: 0
Have a similar project?
Let's talk it over in 15 minutes. No sales pitch, just a technical chat.